Lesson summary
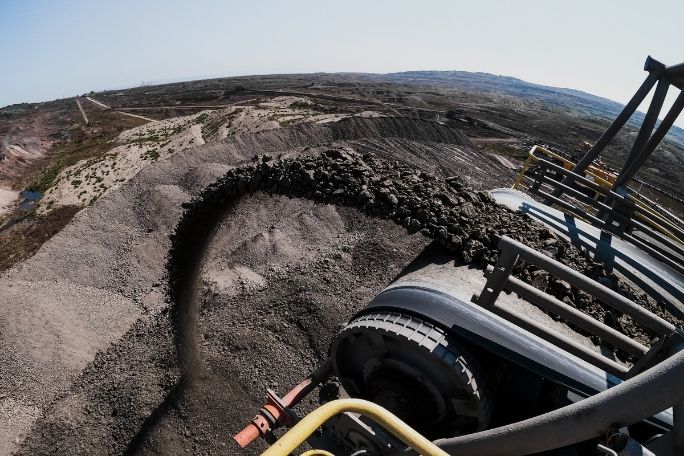
Working in groups, students build a pie chart that demonstrates the percentage of different energy sources used globally. They then put together a 2 minutes presentation about a specific energy source and present it to the class. Students build an understanding the long term viability of different energy sources energy taking into account the financial, environmental and ethical barriers to provide energy for the world’s population.
Learning intentions:
Students will...
- recognise the impact of different uses of energy on our environment and economy.
- formulate energy solutions for the future.
- demonstrate ability to work collaboratively and fairly in problem-solving activities.
- demonstrate ability to research and compile information on issues.
- demonstrate ability to communicate lessons from research through class-wide debate.
Lesson guides and printables

Lesson details
Curriculum mapping
Australian Curriculum content descriptions:
Year 9 Science:
- Use knowledge of scientific concepts to draw conclusions that are consistent with evidence (ACSIS170)
Year 9 English:
- Interpret, analyse and evaluate how different perspectives of issue, event, situation, individuals or groups are constructed to serve specific purposes in texts (ACELY1742)
Year 9 Mathematics:
- Identify everyday questions and issues involving at least one numerical and at least one categorical variable, and collect data directly from secondary sources (ACMSP228)
Year 10 Science:
- Use knowledge of scientific concepts to draw conclusions that are consistent with evidence (ACSIS204)
Year 10 English:
- Use comprehension strategies to compare and contrast information within and between texts, identifying and analysing embedded perspectives, and evaluating supporting evidence (ACELY1754)
Year 10 Mathematics:
- Evaluate statistical reports in the media and other places by linking claims to displays, statistics and representative data (ACMSP253)
Resources required
- Student worksheet (hard copy)
- Pens or pencils
- Internet or library access
Additional info
This is an original Cool.org lesson. Facts and figures in these lessons may have changed since this lesson was published. We always endeavour to update our resources in a timely manner, but if you see an error or issue in our resources please get in touch with us.
Welcome back!
Don't have an account yet?
Log in with:
By signing up to Cool.org you consent and agree to Cool's privacy policy to
store, manage and process your personal information. To read more, please see
our privacy policy here(Opens in new tab).
Create your free Cool.org account.
Many of our resources are free, with an option to upgrade to Cool+ for premium content.
Already have an account?
Sign up with:
By signing up to Cool.org you consent and agree to Cool's privacy policy to
store, manage and process your personal information. To read more, please see
our privacy policy here(Opens in new tab).