Lesson summary
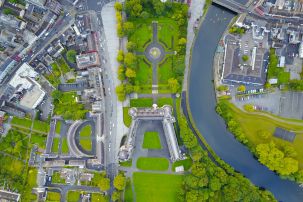
In this practical and hands-on activity students complete a biodiversity assessment of their school. They begin by creating definitions for habitat terms, and then calculate the habitat percentage cover of different cover types (tree cover, roof cover, soft surfaces/grass, and hard surfaces) using a map of the school grounds. Through authentic learning experiences students assess the schools natural resources and where there is opportunities for further actions. Students create a biodiversity improvement development plan.
Learning intentions:
Students will...
- understand that there are a range of habitats at their school.
- understand how to use maps to calculate the percentage of cover types at their school.
- recognise how their biodiversity at their school can be improved.
- create action plans to address natural resource management issues and increase local biodiversity.
Lesson guides and printables

Lesson details
Curriculum mapping
Australian Curriculum content descriptions:
Science Year 7:
- There are differences within and between groups of organisms; classification helps organise this diversity (ACSSU111)
- Interactions between organisms can be described in terms of food chains and food webs; human activity can affect these interactions (ACSSU112)
Mathematics Year 7:
- Find percentages of quantities and express one quantity as a percentage of another, with and without digital technologies. (ACMNA158)
Geography Year 7:
- Collect, select and record relevant geographical data and information, using ethical protocols, from appropriate primary and secondary sources (ACHGS048)
- Represent the spatial distribution of different types of geographical phenomena by constructing appropriate maps at different scales that conform to cartographic conventions, using spatial technologies as appropriate (ACHGS050)
Science Year 8:
People use science understanding and skills in their occupations and these have influenced the development of practices in areas of human activity (ACSHE136)
Geography Year 8:
- Collect, select and record relevant geographical data and information, using ethical protocols, from appropriate primary and secondary sources (ACHGS056)
- Present findings, arguments and ideas in a range of communication forms selected to suit a particular audience and purpose, using geographical terminology and digital technologies as appropriate (ACHGS061)
- Reflect on their learning to propose individual and collective action in response to a contemporary geographical challenge, taking account of environmental, economic and social considerations, and predict the expected outcomes of their proposal (ACHGS062)
Geography Year 9:
- Collect, select, record and organise relevant geographical data and information, using ethical protocols, from a range of appropriate primary and secondary sources (ACHGS064)
- Present findings, arguments and explanations in a range of appropriate communication forms, selected for their effectiveness and to suit audience and purpose; using relevant geographical terminology, and digital technologies as appropriate (ACHGS070)
Geography Year 10:
- The human-induced environmental changes that challenge sustainability (ACHGK070)
- The application of geographical concepts and methods to the management of the environmental change being investigated (ACHGK074)
- Collect, select, record and organise relevant data and geographical information, using ethical protocols, from a range of appropriate primary and secondary sources (ACHGS073)
Cross curriculum priorities
Sustainability OI.1 – The biosphere is a dynamic system providing conditions that sustain life on Earth. O1.2 – All life forms, including human life, are connected through ecosystems on which they depend for their wellbeing and survival.
General capabilities
Critical and creative thinking, Numeracy
** Syllabus Outcomes: GE4-7, GE4-8, GE5-2, GE5-3, GE5-4, GE5-5, GE5-7, GE5-8, SC4-14LW, SC4-15LW, SC4-13ES.
Connecting lessons:** Native animal identification – must be completed as a compulsory action.
Resources required
- Internet access
- Student worksheet
- Maps of school grounds (from Flash Earth or Google Maps)
- Ruler
- Pencil
- Materials for making maps
Additional info
This lesson can be used when working on the Biodiversity Module of ResourceSmart AuSSI Vic Certification. By completing this lesson you will have completed the following actions:
Compulsory Actions:
- A1 – Have you completed biodiversity assessments for your school’s grounds, including the identification and recording of:
- Indigenous/native plants and animal habitat quality e.g. trees, understorey, ground cover weeds and soil management?
- Linkages of school vegetation and habitats with surrounding areas?
- A1 – Has your Habitat Quality Assessment score been entered as your baseline data?
Checklist data goals:
- To estimate a ‘habitat quality score’ as well as the percentage of different elements in the school ground e.g. percentage of school grounds covered by buildings, asphalt, oval/lawn etc.
Welcome back!
Don't have an account yet?
Log in with:
By signing up to Cool.org you consent and agree to Cool's privacy policy to
store, manage and process your personal information. To read more, please see
our privacy policy here(Opens in new tab).
Create your free Cool.org account.
Many of our resources are free, with an option to upgrade to Cool+ for premium content.
Already have an account?
Sign up with:
By signing up to Cool.org you consent and agree to Cool's privacy policy to
store, manage and process your personal information. To read more, please see
our privacy policy here(Opens in new tab).