Lesson summary
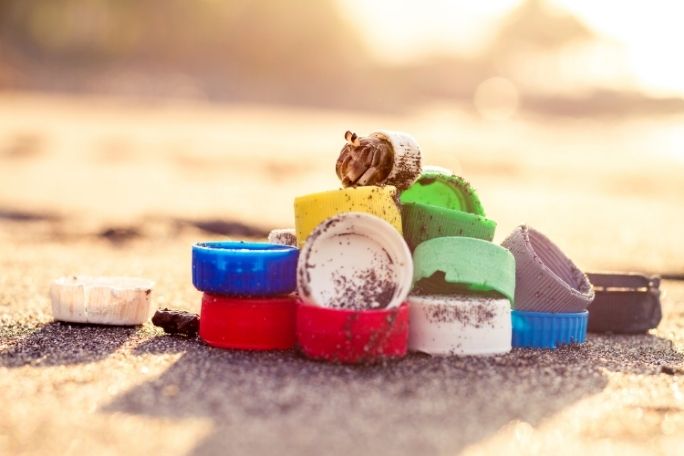
Students will collect and analyse data related to the usage of plastic bottles. They will learn about the difference between recyclable and recycled plastic and calculate the different energy costs to manufacture plastic bottles from raw and recycled materials.
Learning intentions:
Students will...
- understand the difference between recycled and recyclable materials
- know about the environmental effects of using recycled materials
- be able to analyse the data they collect and use graphs to synthesise findings
Success criteria:
Students can...
- explain the difference between recycled and recyclable plastic
- collect and analyse data related to plastic usage
- make informed decisions regarding their use of plastic and its impact on the environment
Lesson guides and printables

Lesson details
Curriculum mapping
Australian curriculum content descriptions:
Year 7 Maths:
- Identify and investigate issues involving numerical data collected from primary and secondary sources (ACMSP169).
Year 8 Maths:
- Explore the variation of means and proportions of random samples drawn from the same population (ACMSP293).
Year 9 Maths:
- Identify everyday questions and issues involving at least one numerical and at least one categorical variable, and collect data directly and from secondary sources (ACMSP228).
Year 10 Maths:
- Evaluate statistical reports in the media and other places by linking claims to displays, statistics and representative data (ACMSP253).
General capabilities: Numeracy, Critical and creative thinking, Ethical understanding.
Cross-curriculum priority: Sustainability OI.8.
Relevant parts of Year 7 Mathematics achievement standards: Students identify issues involving the collection of continuous data.
Relevant parts of Year 8 Mathematics achievement standards: Students explain issues related to the collection of data and the effect of outliers on means and medians in that data.
Relevant parts of Year 9 Mathematics achievement standards: Students compare techniques for collecting data from primary and secondary sources.
Relevant parts of Year 10 Mathematics achievement standards: Students describe statistical relationships between two continuous variables. They evaluate statistical reports.
Unit of work: Visy Education – Secondary Mathematics.
Time required: 70 mins.
Level of teacher scaffolding: Low to medium – the teacher will need to guide students through various pieces of information and stimulus, and assist them to complete a student-guided survey.
Resources required
- Student Worksheets (one copy per student).
- Device capable of projecting images, articles and quotes to the class.
- ‘The Role Of Recycled Plastics In Closing The Loop’ Article
- Global Plastic Production Graph
- Samples of different sized plastic bottles (optional)
- Scales (optional).
Skills
This lesson is designed to build students’ competencies in the following skills:
- Critical thinking
- Global citizenship
- Problem solving
- Social skills
Additional info
This lesson has been developed in partnership with Visy. For over 70 years Visy has been committed to finding sustainable solutions for Australia and New Zealand’s recyclables and helping to reduce local landfills. Visy collects, receives and sorts paper, cardboard, glass, plastics, steel and aluminium from households, businesses and schools with the purpose of reusing these products in the re-manufacture of new packaging products.
Welcome back!
Don't have an account yet?
Log in with:
By signing up to Cool.org you consent and agree to Cool's privacy policy to
store, manage and process your personal information. To read more, please see
our privacy policy here(Opens in new tab).
Create your free Cool.org account.
Many of our resources are free, with an option to upgrade to Cool+ for premium content.
Already have an account?
Sign up with:
By signing up to Cool.org you consent and agree to Cool's privacy policy to
store, manage and process your personal information. To read more, please see
our privacy policy here(Opens in new tab).