Lesson summary
Students will use various methods to interpret and present sets of data that relate to electrical energy usage in Australia and some countries of the Asia Pacific region. They will translate numerical data and information written in prose into data table format, revise statistical terminology and make calculations using numerical data sets.
Learning intentions:
Students will...
- develop knowledge about handling data from numerical and textual sources
- collate and present data sets appropriate to a given purpose and audience.
Lesson guides and printables

Lesson details
Curriculum mapping
Australian Curriculum content descriptions:
Year 9 Mathematics:
- Compare data displays using mean, median and range to describe and interpret numerical data sets in terms of location (centre) and spread (ACMSP283).
- Graph simple non-linear relations with and without the use of digital technologies and solve simple related equations (ACMNA296).
Year 10 Mathematics:
- Evaluate statistical reports in the media and other places by linking claims to displays, statistics and representative data (ACMSP253).
Syllabus Outcomes: MA5.1-1WM, MA5.1-2WM, MA5.1-3WM, MA5.1-7NA, MA5.1-12SP, MA5.2-1WM, MA5.2-3WM, MA5.2-10NA.
Time required: 60 mins.
Level of teacher scaffolding: Medium – oversee activity.
Resources required
- Calculators
- graph paper
- rulers and pencils
- Student Worksheet (one copy per student OR computers/tablets to access the online worksheet)
- device capable of presenting a website to the class
Additional info
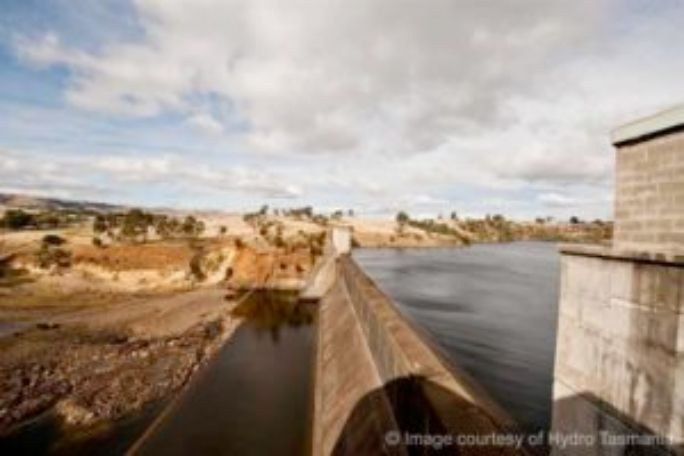
This lesson has been developed in partnership with
Hydro Tasmania.
Hydro Tasmania has been at the forefront of clean energy innovation for one hundred years. It is Australia’s largest producer of clean energy – generating hydro and wind power – and the largest water manager. Hydro Tasmania has 55 major dams, operates 30 hydropower stations and has built some of Australia’s largest wind farms.
Hydro Tasmania also sells energy in the National Electricity Market through its retail business Momentum Energy, and sells its expertise internationally through its consulting business Entura.
Visit the Hydro Tasmania website to learn how the business is working towards Australia’s clean energy future.
Welcome back!
Don't have an account yet?
Log in with:
By signing up to Cool.org you consent and agree to Cool's privacy policy to
store, manage and process your personal information. To read more, please see
our privacy policy here(Opens in new tab).
Create your free Cool.org account.
Many of our resources are free, with an option to upgrade to Cool+ for premium content.
Already have an account?
Sign up with:
By signing up to Cool.org you consent and agree to Cool's privacy policy to
store, manage and process your personal information. To read more, please see
our privacy policy here(Opens in new tab).