Lesson summary
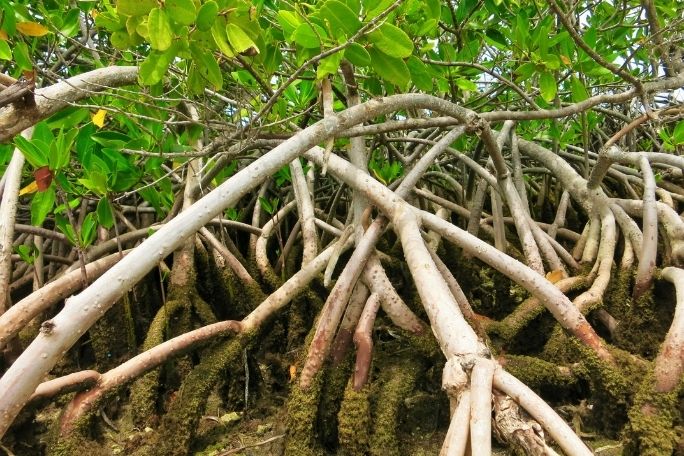
Students assess the extent and health of salt marsh and mangrove ecosystems by analysing MangroveWatch datasets (these can either be the analyses created by the students themselves in previous lessons or the analyses provided by MangroveWatch Science Hub).
Students will assess data for forest presence, biomass, cover score, density score, stand maturity, condition score, as well as threats to and values of salt marshes. Students will use this information to draw conclusions about mangroves and salt marsh ecosystem health and future actions for protecting dependent habitats, such as the Great Barrier Reef.
This lesson is part of a six-lesson unit of work. This unit can be used in sequence to prepare your students to participate in an investigation of mangroves in your local area as part of the MangroveWatch citizen science program.
Learning intentions:
Students will...
- understand data analysis to draw conclusions about environmental health.
Success criteria:
Students can...
- identify what a data set is
- .access appropriate data from a data set to analyse
- use data to calculate the average across a range of data sets
- describe relationships in data
- draw conclusions about the implications of the data
- suggest actions for mangrove and/or salt marsh conservation
- evaluate the reliability and validity of the data.
Lesson guides and printables
Lesson details
Curriculum mapping
Australian curriculum content descriptions:
Year 9 Science:
- Ecosystems consist of communities of interdependent organisms and abiotic components of the environment; matter and energy flow through these systems (ACSSU176)
- People use scientific knowledge to evaluate whether they accept claims, explanations or predictions, and advances in science can affect people’s lives, including generating new career opportunities (ACSHE160)
- Analyse patterns and trends in data, including describing relationships between variables and identifying inconsistencies (ACSIS169)
- Use knowledge of scientific concepts to draw conclusions that are consistent with evidence (ACSIS170)
- Evaluate conclusions, including identifying sources of uncertainty and possible alternative explanations, and describe specific ways to improve the quality of the data (ACSIS171)
Year 10 Science:
- The theory of evolution by natural selection explains the diversity of living things and is supported by a range of scientific evidence (ACSSU185)
- People use scientific knowledge to evaluate whether they accept claims, explanations or predictions, and advances in science can affect people’s lives, including generating new career opportunities (ACSHE194)
- Analyse patterns and trends in data, including describing relationships between variables and identifying inconsistencies (ACSIS203)
- Use knowledge of scientific concepts to draw conclusions that are consistent with evidence (ACSIS204)
- Evaluate conclusions, including identifying sources of uncertainty and possible alternative explanations, and describe specific ways to improve the quality of the data (ACSIS205)
Year 11 and 12 Science – Biology
- Represent data in meaningful and useful ways; organise and analyse data to identify trends, patterns and relationships; qualitatively describe sources of measurement error, and uncertainty and limitations in data; and select, synthesise and use evidence to make and justify conclusions (ACSBL004)
Syllabus outcomes: SC5-14LW, SC5-13ES, SC5-7W
General capabilities: Critical and Creative Thinking, Numeracy
Cross-curriculum priority: Sustainability OI.9
Relevant parts of Year 9 Science achievement standards: Students analyse how biological systems function and respond to external changes. They analyse trends in data, identify relationships between variables and reveal inconsistencies in results. They analyse their methods and the quality of their data, and explain specific actions to improve the quality of their evidence.
Relevant parts of Year 10 Science achievement standards: When analysing data, selecting evidence and developing and justifying conclusions, students identify alternative explanations for findings and explain any sources of uncertainty.
Year 11 and 12 Science students:
- use science inquiry skills to design, conduct, evaluate and communicate investigations into biodiversity and flows of matter and energy in a range of ecosystems.
Unit of work: MangroveWatch – Years 9 to 12
Time required: 180 minutes
Level of teacher scaffolding: Medium – assist students’ interpretation of MangroveWatch Science Hub’s analysis of data sets. Oversee students completion of tasks including the use of MangroveWatch data sets to create pre-formatted charts depicting variables used to assess mangrove and salt marsh distribution, health and condition. Teachers lead students in discussion and reflection.
Resources required
- Access to device and programs capable of supporting Microsoft Excel
- Student Worksheet – one copy per student
- Mooloolah MangroveWatch Report
- Samoa MangroveWatch Report
- SVAM Samoa Data Worksheet
- SVAM Own Data Worksheet
- Data Analysis Sheets
- Own Data or Mooloolah SVAM Data
Skills
This lesson is designed to build students’ competencies in the following skills:
- Collaboration
- Communication
- Creativity
- Critical thinking
Additional info
The lessons in this unit have been developed in partnership with Earthwatch and MangroveWatch. Earthwatch is a global not-for-profit organisation that uses citizen science to empower people to save the natural world, and works with all sectors to create a society that lives in balance with nature. MangroveWatch is a not-for-profit organisation that focuses on the research, education and conservation of mangrove and tidal wetland environments globally.


Welcome back!
Don't have an account yet?
Log in with:
By signing up to Cool.org you consent and agree to Cool's privacy policy to
store, manage and process your personal information. To read more, please see
our privacy policy here(Opens in new tab).
Create your free Cool.org account.
Many of our resources are free, with an option to upgrade to Cool+ for premium content.
Already have an account?
Sign up with:
By signing up to Cool.org you consent and agree to Cool's privacy policy to
store, manage and process your personal information. To read more, please see
our privacy policy here(Opens in new tab).