Lesson summary
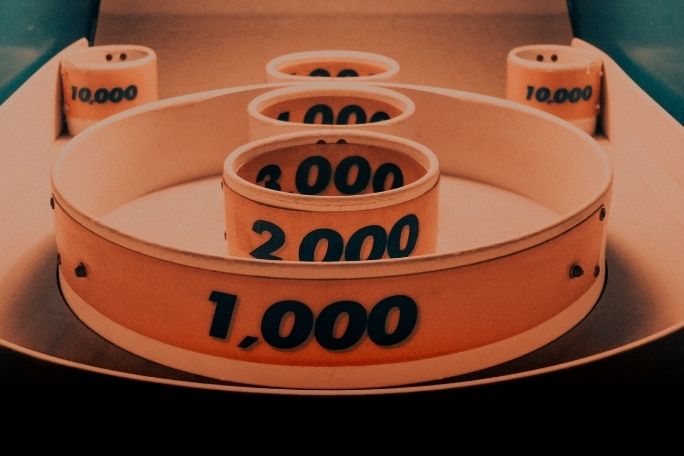
This lesson presents students with some explicit teaching around representing the probability of chance events from games (such as dice games) using fractions and decimals and placing the probability of given events on a probability number line. Following this, students conduct a simple chance experiment based on the outcome events of their ‘Sustainable STEM Sideshow Game’, collect event data and calculate the probability and event frequency of achieving a win in their Game.
Learning intentions:
Students will...
- observe simple games and everyday events to describe them in terms of probability
- assign numerical values to events representing the likelihood of an outcome
- calculate a probability test for a game
- describe the number of times an outcome occurs in chance experiments using the term 'frequency'
- calculate the probability of events using fractions and decimals.
Success criteria:
Students can...
- describe events that are impossible and events that are certain
- use the term 'probability' to describe the numerical value that represents the likelihood of an outcome of a chance experiment
- use the term 'frequency' to describe the number of times a particular outcome occurs in a chance experiment
- use the term 'event' to describe either one outcome or a collection of outcomes in the sample space of a chance experiment
- represent and order probabilities of outcomes of chance experiments using fractions and decimals, e.g. 'Equally likely' would be placed at ½ or 0.5.
Lesson guides and printables
Lesson details
Curriculum Mapping
Australian Curriculum content descriptions:
Year 5 to 8 Mathematics:
- list the possible outcomes of chance experiments involving equally likely outcomes and compare to those which are not equally likely (AC9M5P01)
- conduct repeated chance experiments and run simulations with an increasing number of trials using digital tools; compare observations with expected results and discuss the effect on variation of increasing the number of trials (AC9M6P02)
- conduct repeated chance experiments and run simulations with a large number of trials using digital tools; compare predictions about outcomes with observed results, explaining the differences (AC9M7P02)
- recognise that complementary events have a combined probability of one; use this relationship to calculate probabilities in applied contexts (AC9M8P01)
Syllabus outcomes: MA3-19SP
General capabilities: Critical and creative thinking, Numeracy
Relevant parts of Year 6 and 8 achievement standards:
By the end of Year 6, students compare observed and expected frequencies and they interpret and compare a variety of data displays including those displays for two categorical variables. Students add, subtract and multiply decimals and divide decimals and they describe probabilities using simple fractions, decimals and percentages.
By the end of Year 8, students represent the possible combinations of 2 events with tables and diagrams, and determine related probabilities to solve practical problems. They conduct experiments and simulations using digital tools to determine related probabilities of compound events.
Time required: 90 mins (two 45-50 min lessons)
Level of teacher scaffolding: High – Teacher needs to explain various mathematical concepts around probability and assist students to apply the outcomes and event frequencies in their own Sideshow Game to the mathematical conceptual framework around probability.
Resources Required
- calculators – per student (for calculating decimal probability ratios)
- dice (either digital and projected on a data projector or whiteboard, or large dice that the whole class can see)
- interactive whiteboard or data projector
- Student Worksheet for Lesson 2: Probability (one per student)
- students’ ‘Sustainable STEM Sideshow Game’ prototypes, from Lesson 1 of this Unit – set up ready to ‘test’ in a tabloid arrangement in the classroom or learning space
- whiteboard (or electronic whiteboard) with pens.
21st Century Skills
This lesson is designed to build students’ competencies in the following skills:
- critical thinking
- problem solving.
Additional Info
This is an original Cool+ lesson.


Welcome back!
Don't have an account yet?
Log in with:
By signing up to Cool.org you consent and agree to Cool's privacy policy to
store, manage and process your personal information. To read more, please see
our privacy policy here(Opens in new tab).
Create your free Cool.org account.
Many of our resources are free, with an option to upgrade to Cool+ for premium content.
Already have an account?
Sign up with:
By signing up to Cool.org you consent and agree to Cool's privacy policy to
store, manage and process your personal information. To read more, please see
our privacy policy here(Opens in new tab).